Data Set Visualization
Table of contents
Classification Example 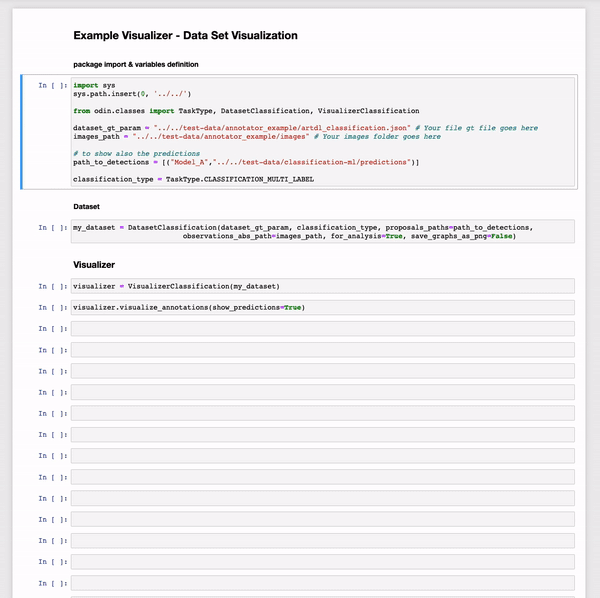
Localization Example 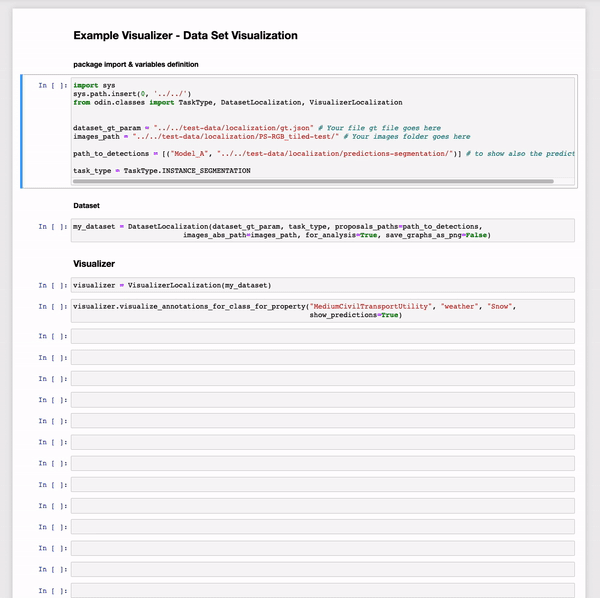
visualize_annotations()
It shows all the ground truth and, at user request, the related predictions.
Parameters
- categories
list, optional- List of categories to be included in the visualization. If not specified, all the categories are included.
(default is None) - show_predictions
bool, optional- Indicates whether to visualize also the predictions.
(default is False)
Example
Classification
from odin.classes import VisualizerClassification

my_visualizer = VisualizerClassification(models)
my_visualizer.visualize_annotations(show_predictions=True)
Localization
from odin.classes import VisualizerLocalization

my_visualizer = VisualizerLocalization(models)
my_visualizer.visualize_annotations(show_predictions=True)
Tasks supported
| Binary Classification | Single-label Classification | Multi-label Classification | Object Detection | Instance Segmentation |
|---|---|---|---|---|
| yes | yes | yes | yes | yes |
visualize_annotations_for_property()
It shows all the ground truth with a specific property value and, at user request, the related predictions.
Parameters
- meta_annotation
str- Name of the property to be visualized.
- meta_annotation_value
str or float- Value of the property to be visualized.
- show_predictions
bool, optional- Indicates whether to visualize also the predictions.
(default is False)
Example
Classification
from odin.classes import VisualizerClassification

my_visualizer = VisualizerClassification(models)
my_visualizer.visualize_annotations_for_property('property_name',
                                                 'property_value',
                                                 show_predictions=True)
Localization
from odin.classes import VisualizerLocalization

my_visualizer = VisualizerLocalization(models)
my_visualizer.visualize_annotations_for_property('property_name',
                                                 'property_value',
                                                 show_predictions=True)
Tasks supported
| Binary Classification | Single-label Classification | Multi-label Classification | Object Detection | Instance Segmentation |
|---|---|---|---|---|
| yes | yes | yes | yes | yes |
visualize_annotations_for_class_for_property()
It shows all the ground truth of a category with a specific property value and, at user request, the related predictions.
Parameters
- category
str- Name of the category to be visualized.
- meta_annotation
str- Name of the property to be visualized.
- meta_annotation_value
str or float- Value of the property to be visualized.
- show_predictions
bool, optional- Indicates whether to visualize also the predictions
(default is False)
Example
Classification
from odin.classes import VisualizerClassification

my_visualizer = VisualizerClassification(models)
my_visualizer.visualize_annotations_for_class_for_property('category_name',
                                                           'property_name',
                                                           'property_value',
                                                           show_predictions=True)
Localization
from odin.classes import VisualizerLocalization

my_visualizer = VisualizerLocalization(models)
my_visualizer.visualize_annotations_for_class_for_property('category_name',
                                                           'property_name',
                                                           'property_value',
                                                           show_predictions=True)
Tasks supported
| Binary Classification | Single-label Classification | Multi-label Classification | Object Detection | Instance Segmentation |
|---|---|---|---|---|
| yes | yes | yes | yes | yes |